


Propagation
The UBA propagation forecasts
 The UBA propagation forecast are now created dynamicaly with data from a database. It's Danny ON8DS who helped us to create the propagation forecast script. By clicking here you will get the propagation charts for the current month. With the same interface you can also access the propagation forcast for the other months of the current year (if the data is already available).
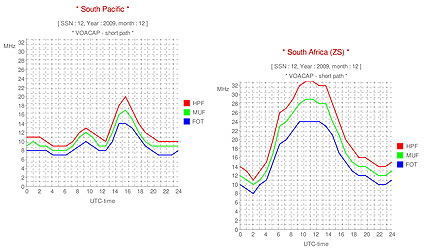
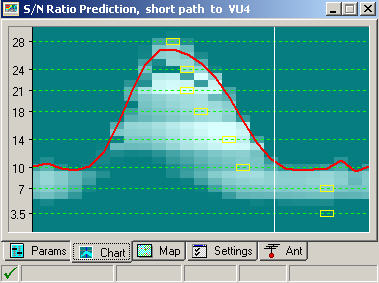
The 3 coloured lines on the charts represent:
| HPF | Highest Possible Frequency: during (only) 10% of the days propagation may be possible at these frequencies or higher |
| MUF | Maximum Usable Frequency: during 50% of the days propagation may be possible at these frequencies or higher |
| FOT | Frequency Optimal Traffic: during 90% of the days propagation may be possible at these frequencies or higher |
The data used for creating the propagation charts were generated using VOACAP. The charts are based on the last available SSN (smoothed Sunspot Number) predictions. Calculations were done for Short Paths starting from Belgium to the indicated locations.
Smoothed Sunspot Number
When the daily sunspot count is plotted over a month's time, the graph is very spiky. Averaging daily sunspot numbers over a month results in the monthly average sunspot number, however it also results in a spiky plot. A smoother plot is desired by researchers. To get that, they choose a more averaged, or smoothed, measurement to measure solar cycles. This is the so-called smoothed sunspot number (SSN) calculated across five and a half months of data before and after a desired month, plus the data for the desired month. The amount of smoothing leaves the official SSN a half year behind the current month.
The above graphics (source: Sunspot Index Data Center in Brussels), represent solar cycles 22-23. The red line is the monthly smoothed sunspot number while the blue line is the actual monthly sunspot number. Cycle 22 started in September 1986 at 12.3. Cycle 23 started in May 1996 with the monthly SSN at 8.0 and peaked in April 2000 at 120.8.
How to get the correct SSN? (contributed by ON4SKY)
SSN calculation is based on the Lincoln-McNish smoothing function. George Lane, one of the main VOACAP developers, recommends to use the SSN listed at NGDC FTP website because other SSNs are supposed to give erroneous results. For the small story, only the NGDC's SSN has been used to calibrate the predictions from VOACAP, hence George's recommendation. HFradio.org have well understood the message and suggests to all readers searching for archive and data approved for research to connect on NGDC website. They provide however the "Predicted SSN" interpolated by IPS Radio Space Services, Australia, like do SEC... but the SSN provided does not match what IPS called "SSN"! (see table below). In addition, HFradio.org provides data from various observatories for readers wishing to get an overview of the current solar and spaceweather status or general forecasts. But they state also that "forecasting is an inexact science"...
SSN: current, predicted, equivalent, effective...
| NGDC: | Predicted SSN = 41.7 (the only one source for VOACAP) |
| IPS: | SSN = 44.4 |
| SEC: | Predicted SSN = 33.6 (stated from IPS) |
| HFradio.org: | Predicted SSN = 33.6 (stated from IPS) |
| GeoAlert-Extreme: | Equivalent SSN = 31 (stated from SEC) |
| WinCAP Wizard3: | SSN = 34 (stated from SEC) |
| DX ToolBox: | SSN = 36 (in fact calculated for August 29) |
| IonoProbe: |
Current SSN = 36 (in fact the Sunspot number for Aug 30) Effective SSN = 89 (from real-time interpolation) |
| HFProp: | SSN = 29 |
|
Some "SSN" and assimilated values predicted or calculated for "August 2004" compiled from various observatories and applications on August 30 at 16h30 UTC. Note that sunspot number (close to the SSN value but lower), RI and other ISN are different thing than SSN, therefore I haven't list them to avoid still more confusion in your mind, Hi!
|
|
SEC/NOAA maintains also SSN indices which numbers are slightly different from the one published by NGDC. Between both sites the " SSN" difference reaches 60%... SSN published by SEC are (unfortunately) used by many VOACAP-based applications, to name WinCAP Wizard 3 (even though, its value is different, see the above table), hence the belief that SEC provided the SSN for VOACAP.
As you understood, nobody predicts the same SSN as NGDC! Theoretically SSN represents predictions for what we call the "predicted SSN" or SSN. The smoothing is usually over time periods of about 6 months to one year or more so both the daily and the monthly values for the sunspot number as displayed at Spaceweather.com will always fluctuate around predicted numbers. But stop here because RI and other ISN are still other indices to not confuse with SSN.
If during periods of low sun activity these median values don't differ much from one site to another or in relation to the real values, during the period of sun paroxysm, these averages can be very different from the daily real values. So, whatever the improvement made on the VOACAP engine of your application, to get better propagation forecasts, always run the simulation with values up to 20% higher and lower than the SNN to see what happens. Your DX coverage can vary from 10 to 25%!
At last, as you noted, VOACAP doesn't provide any connexion to the Internet to update automatically these fields or to use the system date. Hopefully other interfaces solved this problem to name WinCAP Wizard 3 that calls GeoAlert-Extreme Wizard or DXAtlas that calls IonoProbe to retrieve the monthly update.
The SSN or the solar flux at 10.7 cm (F10.7) is the main factor to consider when calculating the propagation for a band. The sun activity (radiation pressure) is not without effects on the ionization of ionospheric layers but also on the temperature and pressure of the high atmosphere of the Earth.
This second effect mainly affects the lowest band propagation, a factor too rarely considered in propagation programs that ignore the weather conditions as well as other factors (e.g. Appleton's magneto-ionic theory), and VOACAP doesn't go against the rule.
For example, there is no input in VOACAP for the geomagnetic field, A- or K-indices despite their utility to detect a possible geomagnetic disturbance or a storm. This can be a problem if you want to work via the North Pole, during auroral activities, or on the top band, to establish short-term forecasts, or when working with vertical antennas at low latitudes. Here also, more recent applications developed new methods to bypass this problem, using for example real-time ionosondes (e.g. DXAtlas).
The predicted Smoothed Sunspot numbers according to the NGDC FTP website are:
| YEAR | JAN | FEB | MAR | APR | MAY | JUN | JUL | AUG | SEP | OCT | NOV | DEC |
| 2009 | 10.4 | 12.0 | 13.7 | 15.7 | 18.1 | 20.6 | 23.3 | 26.3 | 29.3 | 32.8 | 36.7 | 40.4 |
Make your own predictions now
|
VE3NEA, the author of DX Atlas and other excellent radio amateur software, turned the complicated VOACAP program into something very simple which every ham can manipulate to create its own forecasts.
All you need to do is to enter your own geographic coordinates, as well as the prefix or call of the target station or area, the power and antennas, and bingo! In just a few seconds the program will create some beautiful charts and maps, one of which shows you the MUF line as well as the times of best propagation for each band. Too much to explain here. You can download this freeware from here. |
 |
Other HF-propagation related sites
 |
All about propagation now |
| Propagation forecasts | |
| Current conditions | |
| Website ON5AU | |
| Website ON4AA | |
| Dourbes Digisond |